July ratings are influenced by two main factors, mutually reinforcing each other:
- the consequences of changing the telemetry panel in June
- seasonal trends in TV viewing (both in terms of viewing time and share of top4 and theme channels)
The effects of these factors can be seen in the graphs below.
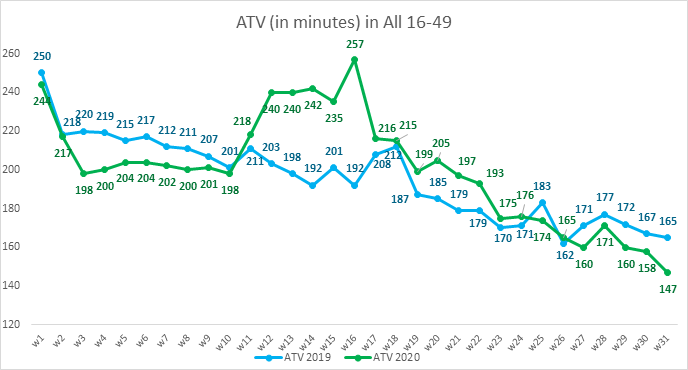
The average time spent in front of the TV (ATV) this year (January – July) is 200 minutes, which means that it is 4 minutes higher than for the same period of the previous year (+2%), but it is influenced by high viewing figures from March and April. However, already in July, we see significantly lower ratings, on average by 11 minutes, compared to July 2019. Interestingly, in 2019, in the last 2 weeks of July, ATV decreases in television slowed down. In 2020, on the other hand, they are getting worse. This may be an effect of “blowing off steam” after the lockdown period and the accumulation of vacation trips during that time. We assume that this trend will continue at least until the end of the summer holidays, we will observe it and consistently comment on it.
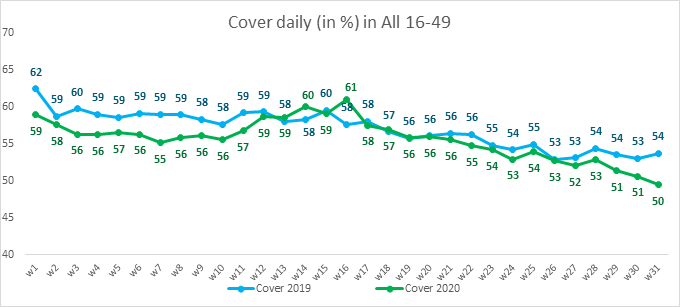
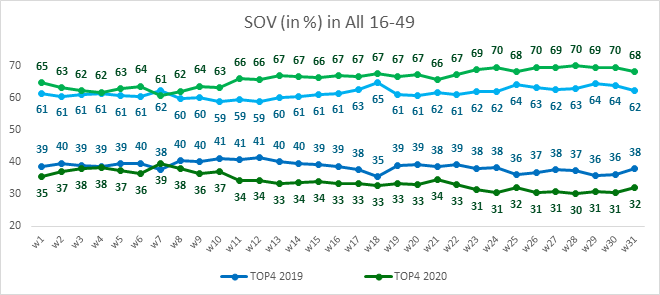
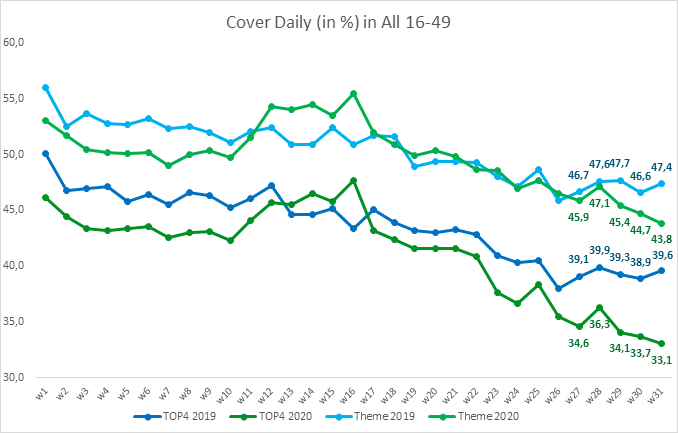
The daily TV coverage this year (January-July) is 55.5%, down 2.5pps from last year. It is clearly visible that the enlargement of the telemetry panel has significantly weakened the reach of TOP4 stations, which in July amounted to 34.4%, which is 4.9 pp less than in July 2019. Theme channels also decreased by 1.8 pp. until July 2019, reaching 45.4%.
The data also clearly shows a higher share of theme channels vs. TOP4 since March 2012 – Top4 channels at 34.1% (vs. 38.6% in 2019), theme channels at 65.9% (vs. 61.4% in 2019).