
The so-called “share of voice principle” is able to determine the ability of brands to build or lose their market shares. As a reminder, brands that spend more on category-wide communication (SOV) than their market share (SOM) grow. Those that spend below this value shrink. The scale of change is proportional to the size of the difference between SOV and SOM.
The increasing weight and share of internet communication has made this measure no longer applicable. Since it has still not been possible to create a reliable method of calculating expenses on the Internet, determining the SOV for a brand has become impossible. And a measure that does not take the medium in which many brands spend most of their advertising budgets into account ceases to have a practical application.
Therefore, for a few years now, another indicator has been sought that would be adapted to the specifics of modern communication and media. One of the searchers is the well-known English advertising effectiveness expert Les Binet, who recently published the results of his several years of analysis.
Binet was considering various indicators as a successor to SOV. One of them was the share of buzz, for which no positive correlation could be found between the number of mentions and real purchase decisions. It even turned out that the brands that people talk about most online (e.g. Ferrari) are the least frequently bought by them. The same happened to the emotional attachment of mentions of a brand, or sentiment. Brands were most criticized by those people who bought the most.
Unable to rely on what people say, Binet decided to focus on what they actually do. That is why he devoted the last 6 years to testing another measure. His focus has been on share of search (SOS), i.e. the share of organic searches in Google of a particular brand in the total search of a particular category. After testing it in 3 categories (automotive, energy, meaning gas and electricity, and cell phones), Binet announced that he found an inexpensive, easy to use and fast way to measure a brand’s potential for growth or shrinkage equivalent to the SOV of digital communication times. In the course of his research, he discovered some interesting patterns associated with the new measure.
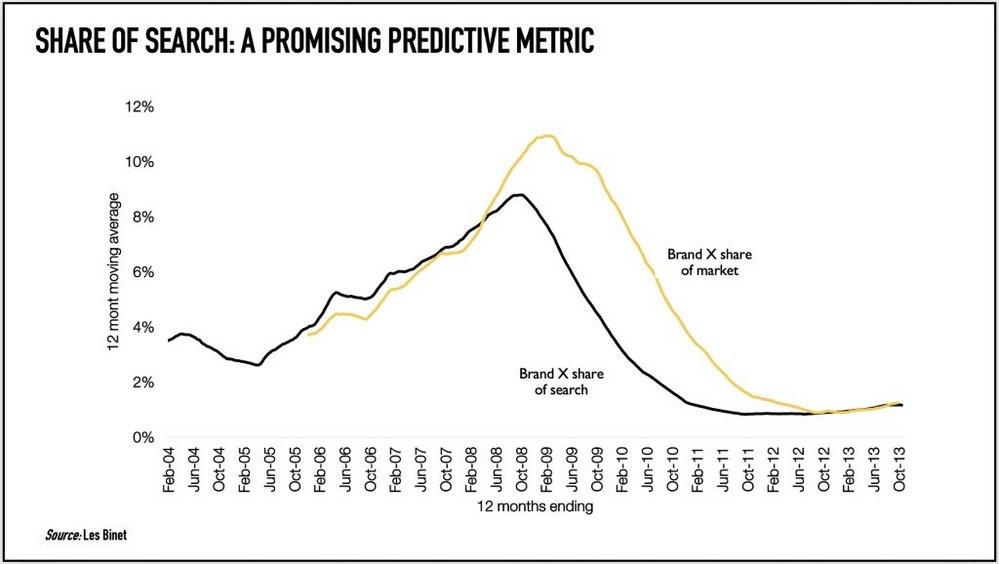
Firstly, SOS shows a correlation with SOM in all the examined categories. The indicator works in a similar way to the “SOV principle”. When the SOS grows, the SOM also grows. When the SOS drops, so does the SOM. And the difference between the SOS and the SOM is a good indication of the scale of the expected change in market shares.
The time perspective of the impact of an SOS on an SOM is extended over time and varies according to the category. For the energy market, the interval between changes in the SOS and similar shifts in the SOM is up to 3 months. For cell phones this period is extended to 6 months. And for the car market the interval is between 9 and 12 months. In one of the analyzed cases (Chart 1) the SOS increases and decreases were 6 months ahead of the corresponding SOM shifts. Thanks to such a large time shift, those responsible for the brand using the “SOS rule” would have six months to implement measures to save the brand’s position when a downward trend was noticed. Therefore, the new measure can act as an early warning system for brands in terms of their market shares.
However, SOS is not a flawless indicator, as conversion is influenced by many different factors, e.g. price, which cannot be taken into account in the new measure. Also not every search means positive interest in a brand. The SOS for the Volkswagen brand, for example, has increased significantly during problems with exhaust emission testing. However, the brand’s market share fell during this period. That is why Binet is now working on finding a way to separate positive and negative searches in order to be able to predict the direction of SOM changes even at times that are unusual for the brand.
Binet has also noticed several relationships between advertising expenses and SOS, which, for example, show the importance of constant, consistent brand communication.
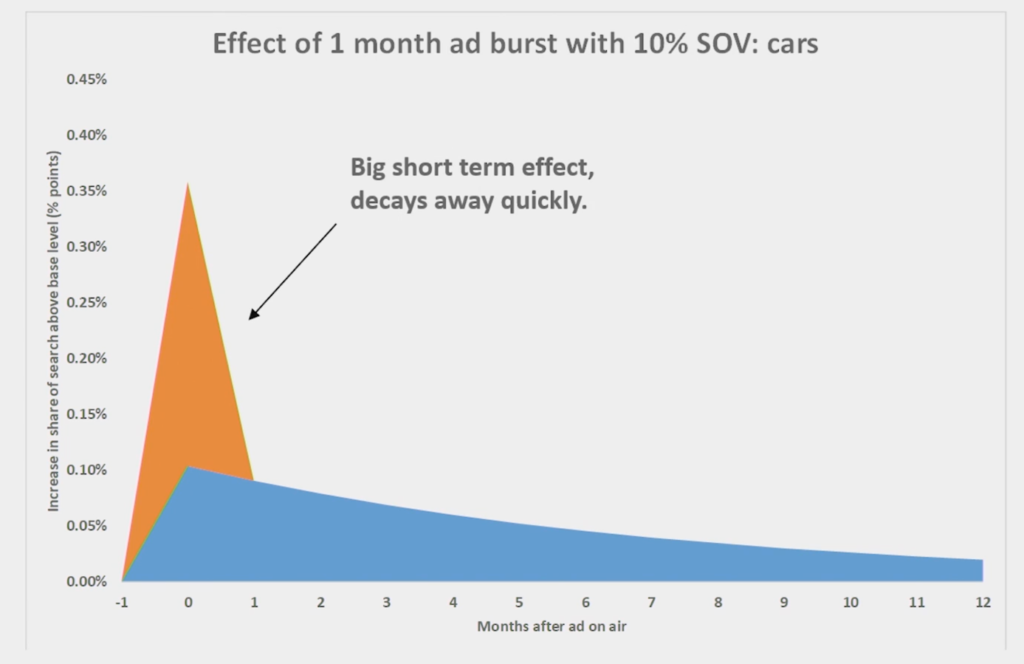
Firstly, advertising activities influence the new indicator in two ways. The most noticeable is a clear and rapid increase in the number of searches, which ends at least a month after the communication is completed. The second increase is smaller, but much more long-lasting and lasts up to 12 months (Chart 2).
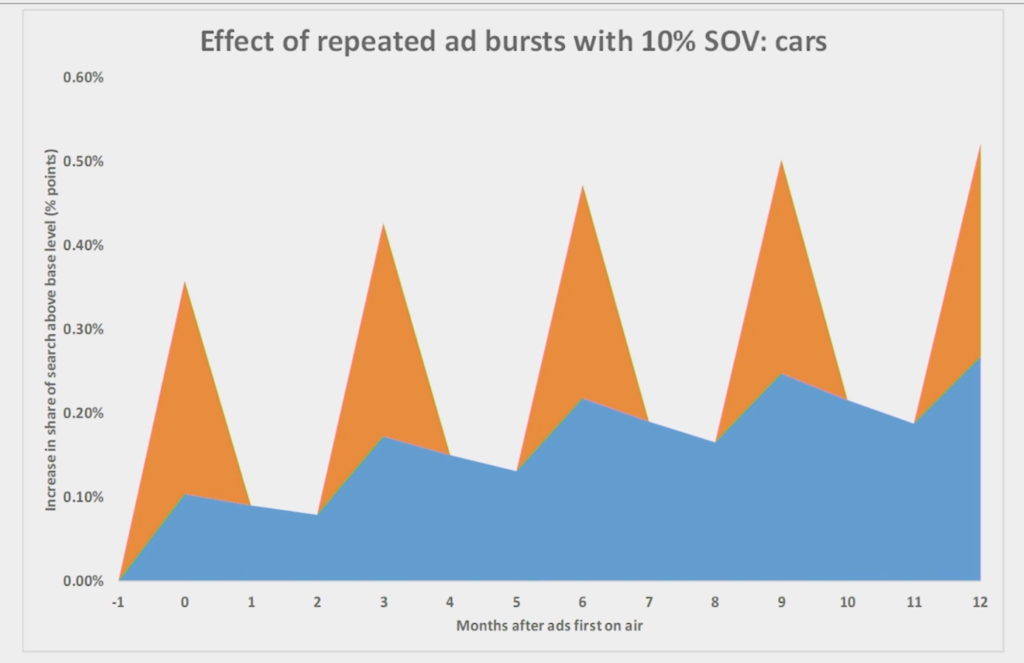
Secondly, the long-term effect of the actions cumulates with time (Chart 3).
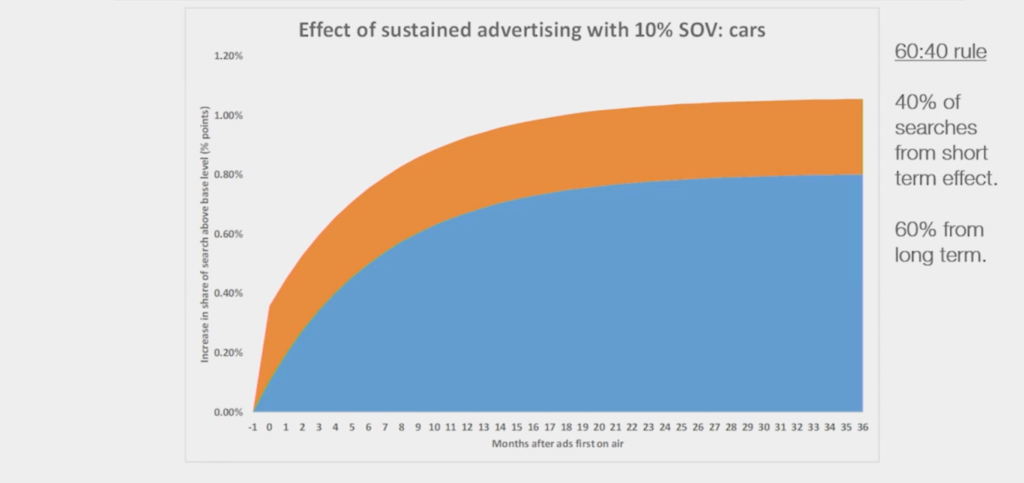
Thirdly, continuous communication translates into SOS in such a way that 60% of searches come from long-term communication effects and 40% from short-term effects (Chart 4).
Binet believes that SOS can also be a tool to measure the condition, strength of a brand by determining its underlying SOS in a situation where communication is not being conducted.
Based on the knowledge gathered by Les Binet during several years of analysis, it can be said that Share of Search is not an ideal measure and still requires attention when using it. Similarly as a number of additional analyses which will check the possibility of using it in different countries and categories. At this point it is certainly the simplest and best tool available to create forecasts about the future of the brand and its competitors. Therefore, it is worth checking its usefulness for your brand and category.
Sources: contagious.com, ipa.co.uk.
Comment by Przemysław Włodarski, Performics
Share of Search is a new indicator recently presented by Les Binet at EffWorks Global 2020. Among this year’s novelties it seems to be one of the most discussed topics in the marketing industry. I think it’s completely deserved.
It is simple, intuitive and does not require a doctorate to be able to use it to some extent in brand management. However, we must remember that this is a predictive indicator, which is not an oracle in itself, but rather shows the resultant of different forces on the market. What is more, as a predictive indicator it is imperfect – it does not guarantee any effects, but only shows some kind of trend on the market or probability of achieving some effects.
On the one hand, it is immune to unexpected events such as the current pandemic or exceptional events such as the infamous dieselgate scandal. On the other hand, we must remember that the factors ultimately affecting the purchase are more than just the level of interest. This is, for example, the price – and it influences the final “conversion level” from share of search to search of market.
Another factor that needs to be taken into account is the data source. In the Polish reality, the Google search engine has over 90% coverage – so it is a reliable source of data. However, we must remember that there are other search engines where users looking for information about a particular category can go. This is true, for example, in the case of gaming, where data about players correlates much less with search trends.
So, is it worth looking at and analyzing the share of search factor?
Definitely yes, but we have to remember that this is not the Holy Grail of marketing and we should base our actions on the analysis of more factors.